

Service · Coming soon
Safety analytics
Crash records take years to accumulate. Conflicts happen every day. TDS films the intersection, tracks every vehicle, and measures each interaction where two paths cross within a few seconds of each other. The result is a picture of where and how collisions nearly happen at a site, in days rather than years.
Video is processed on TDS hardware. An analyst reviews every flagged event before anything is reported; machine measurements are never released without that review.
Deliverables
| Recording | One camera on a pole or trailer for 24 to 72 hours, with the whole intersection box and each approach in view. TDS supplies and places the camera. |
|---|---|
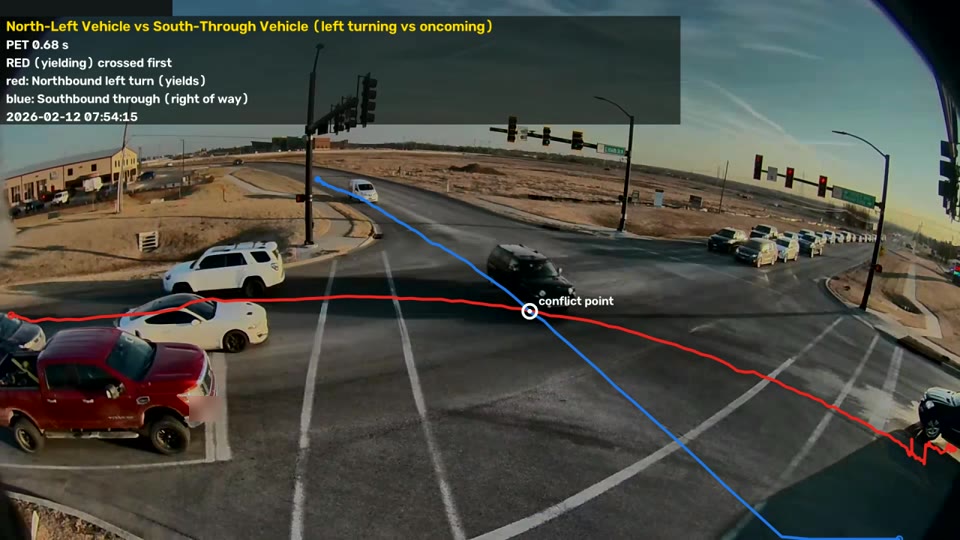
| Measurement | For every pair of paths that cross: post-encroachment time (the gap between the first vehicle clearing the crossing point and the second arriving) and the speed of each vehicle at that point. |
| Safety Snapshot (PDF) | One page per movement pair: how many interactions, how close, the speed of the vehicle with right of way, and a rate per 1,000 vehicles on the limiting movement. Volumes come from a TDS turning-movement count of the same video. |
| Conflict map | Every crossing point drawn on the camera view. |
| Event CSV | One row per interaction: time, movements, who crossed first, post-encroachment time, speeds, review status, clip reference. Opens in Excel. |
| Evidence clips | An annotated video of every measured interaction: the yielding vehicle in red, the vehicle with right of way in blue, live speed, and the gap in seconds. A separate folder holds the events where the yielding vehicle went first with a short gap. |
| Measurement statement | Where on the road the timings are valid, how the camera was calibrated, and what was withheld. Every number is traceable to a clip. |
| Turnaround | Quoted per site. A 48-hour recording is measured the day after collection; analyst review adds the time needed for the number of flagged events. |
When this study is used
Any pair of crossing movements at an intersection: left turns against oncoming traffic at permissive signals, through movements that cross each other at two-way stop-controlled intersections or when a signal is run, right turns across pedestrian and bicycle crossings, and pedestrian and bicycle interactions with turning vehicles at signalized intersections; rural highway unsignalized intersections, where crossing and turning gaps from the minor road are the concern; before-and-after studies of a signal timing, geometry or control change; prioritising intersections in a corridor when crash data is thin; and evidence for a road safety audit or an HSIP application.
Frequently asked questions
How does this help?
It lets engineers and agencies see safety concerns at an intersection ahead of time, from what road users actually do there, instead of waiting for crash reports to accumulate after incidents. The observed conflicts, by movement pair, give a factual basis for countermeasures such as protected left-turn phasing, extended clearance intervals or a revised phase sequence, and a way to measure the same site again after the change.
Is this a crash prediction?
No. Conflicts are surrogate indicators of where collisions nearly occur. They do not predict a number of future crashes.
What is post-encroachment time?
The time from the first road user leaving the crossing point to the second arriving. Shorter is a nearer miss.
How many cameras?
As many as the intersection needs. Most four-leg sites are covered by one camera; complex or wide intersections get additional cameras, with each movement pair analysed from its best view.
How it works
From video to report
- Record.
One camera on a pole or trailer, 24 to 72 hours, the whole intersection box and each approach in view. TDS supplies and places the camera. - Process.
Every vehicle, pedestrian and bicycle is tracked through the video and assigned a movement, using the same engine that produces TDS turning-movement counts. - Calibrate.
The camera view is tied to the ground with two or more distances read off aerial imagery, such as pole to pole or lane width. No survey crew. - Measure.
For every pair of paths that cross, the post-encroachment time and the speed of each vehicle at the crossing point are computed. - Review.
An analyst watches the flagged events and confirms them before anything is reported.

Need counts for an upcoming study?
Send us your locations and collection requirements and TDS Traffic will return a written scope and price. Or email support@tdstraffic.com.